Measure Valley Length & Slope Exercise
Exercise Objective
To learn how Valley length and slope for the South Brush River near Ryan Park, Wyoming Reach are measured using topographic maps and aerial photos.
Exercise Process
- Download the high resolution topographic map and aerial photograph for the South Brush River Reach shown in the low resolution map and photograph images on this page. Two options for obtaining the images: 1) You may right click your mouse on the hyper-link in the previous sentence to "Save Target As...", and "Save As" a name relating to the FGM slide, such as fg_2_18_02a.jpg in a folder retrievable by ImageJ, or 2) You may left click with your mouse on the low resolution versions images on this page to open a new browser window with the high resolution imagery. In the new browser window, right click on that high resolution image and select to "Save Picture As..." Similar to the FGM exercise in Section 1 you, will need to "Save In" a folder that can be accessed by ImageJ. You may want to create a sub-folder in ImageJ for FGM Module maps and photos. You may want to name the image after the FGM slide, such as fg_2_18_02a.jpg. save the .jpg images to a folder.
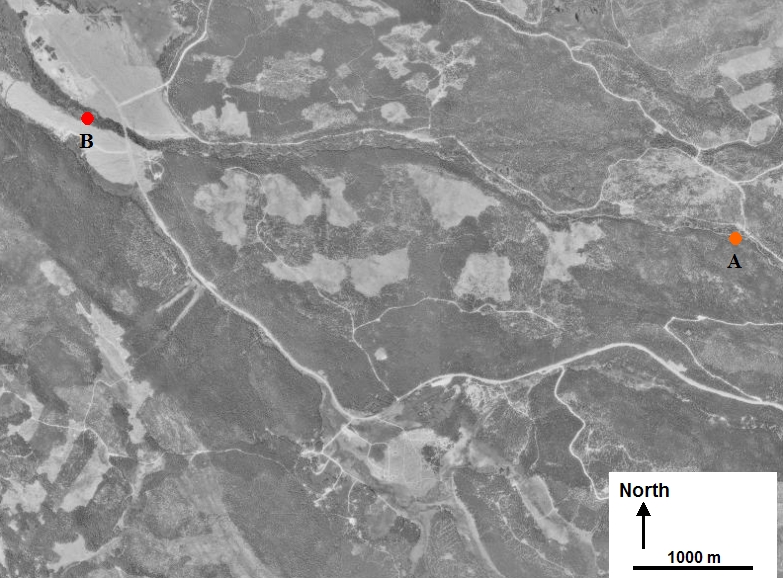
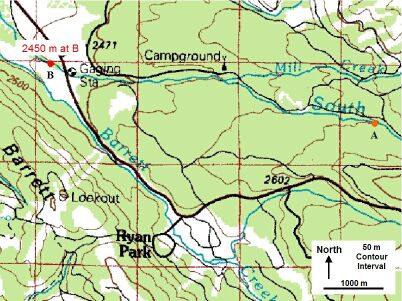
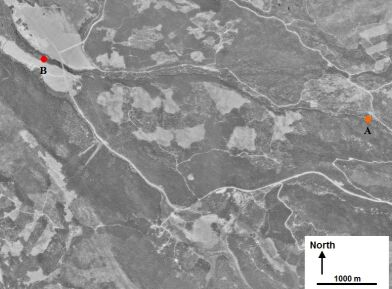
- Launch ImageJ, and use the Menu > File > Open... (Ctrl+O) option to select the topographic map image you just saved. A new window will open with the topographic map image, showing two points, orange and red, along the headwater channel, as well as a new 200 m scale bar for the focused section of map. The dots delineate a Reach of river thought to have similar FGM properties. Now you should have two ImageJ windows, the first containing the Menu and Toolbar options, the second the topographic map.
- Measure Elevations for the upstream and downstream end of the Reach. In the second ImageJ window, estimate the Elevation associated with the orange and red dots, or points A and B. Note that the Elevation contours increment at 50 m, as indicated on the map scale. Record the Elevations at points A and B in your notes for future use in this FGM Module Section 2.
- Measure the Valley distance between the downstream and upstream end of the Reach. Either in the existing ImageJ window with the topographic map, or in a new ImageJ window with the aerial photograph (which also shows the two Reach points), measure the linear distance between the two points. In some applications, one image product is better or more current than the other for clearly viewing or representing the features of interest. In this application you may use either. Both are similarly projected. Note that to measure this distance, you will first need to use the ImageJ Straight line selections tool and the Menu > Analyze > Set scale... feature with the image scale information. To review this procedure, see FGM Module Section 1 page 25 (fg_1_25.php). Once you have set the ImageJ scale, use the Straight line selections tool to draw a straight line between the two river Reach points. Use the ImageJ Menu > Analyze > Measure (Ctrl+M) to obtain this length estimate, and record this as the length of the Reach Valley.
- Compute Valley slope for this Reach. First compute the difference in your two Elevation points (upstream minus downstream). Take this value, represented in length units of meters, and divide it by the length of the Valley distance between the points, represented in meters. This quotient is the valley slope. Record this value for future use in this FGM Module Section 2.
Image courtesy of USGS
|
Developed by