
| glossary | menu | Normal | lg | hc | 2.) FGM and Operational River Forecasting > Hydrograph Adjustment with Roughness Exercise |
| < Previous | 1 | 2 | 3 | 4 | 5 | 6 | 7 | 8 | 9 | 10 | 11 | 12 | 13 | 14 | 15 | 16 | 17 | 18 | 19 | 20 | 21 | 22 | 23 | 24 | Next > |
Hydrograph Adjustment with Roughness Exercise
Exercise Objective
To apply previous knowledge of river behavior to understanding impacts of river roughness, measured in dimension.Roughness is an assessment of protrusions into the flow regime, often by vegetation, debris, rocks, sediment, and human infrastructure. It is measured or empirically derived during cross-sectional assessments, and often illustrated in cross-sectional maps.
Exercise Process
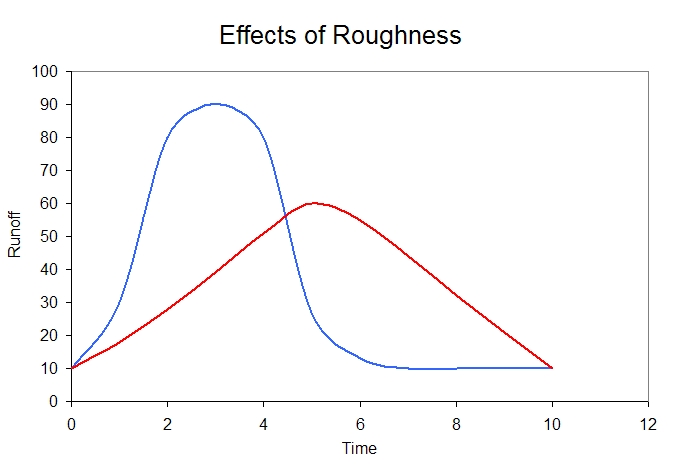
- Examine the image showing the two hydrographs, which graphs of change in runoff with time in red and blue colors. Each hydrograph is a unitless sketch of runoff for the same precipitation event across the same watershed area. The hydrographs have the same total volume of runoff, but differ in timing and magnitude because of differences in the river roughness.
- Try and determine which graph represents a river with lower roughness, and which represents a river with higher roughness.
- Once you have made your choice, advance to the next slide to find the key for the two colored lines.
| < Previous | 1 | 2 | 3 | 4 | 5 | 6 | 7 | 8 | 9 | 10 | 11 | 12 | 13 | 14 | 15 | 16 | 17 | 18 | 19 | 20 | 21 | 22 | 23 | 24 | Next > |