
| glossary | menu | Normal | lg | hc | 1.) Fluvial Geomorphology Training Module > Data Measurement Exercise |
| < Previous | 1 | 2 | 3 | 4 | 5 | 6 | 7 | 8 | 9 | 10 | 11 | 12 | 13 | 14 | 15 | 16 | 17 | 18 | 19 | 20 | 21 | 22 | 23 | 24 | 25 | 26 | 27 | Next > |
Data Measurement Exercise
Exercise Objective
To become familiar with ImageJ features through measurement of river Reach length and watershed area. River Reach length is a central concept to FGM analysis, used for computation of slope and Sinuosity, for example. Watershed area is also of paramount importance, used to estimate regional river flows, stratify river geometry and flows, or estimate sediment loads depending on land use types.Exercise Process
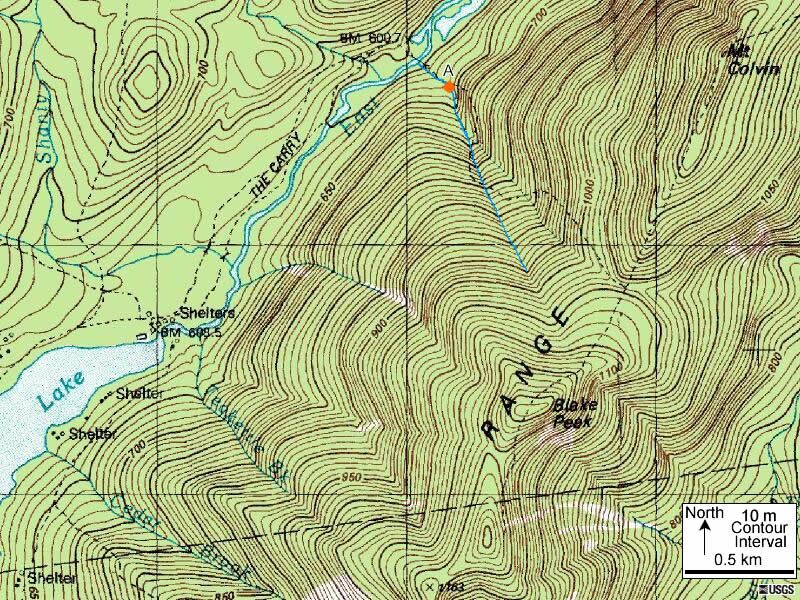
- Download the map. Left click on the hyper-linked topographic map on this page and a new Internet browser will open with an enhanced resolution image of the map. Right click on that enhanced resolution image and choose to "Save Picture As...", and "Save In" a folder that can be accessed by ImageJ. You may want to create a sub-folder in ImageJ for FGM Module maps and photos. You may want to name the image after the FGM slide, such as fg_1_25.jpg.
- Launch ImageJ and open the map. In ImageJ, use the Menu > File > Open... (Ctrl+O) option to select the image you just saved. A new window will open with the topographic map image, but without the delineated watershed outline. Near the center, top of the image an orange dot will be present, indicating an arbitrary terminus for this headwater river. Now you should have two ImageJ windows, the first containing the Menu and Toolbar options, the second the topographic map.
- In the Menu-based ImageJ window on the Toolbar, choose to use the Magnifying glass by clicking on it with the left mouse button. Position your cursor over the second ImageJ window (map) at the scale bar, and left click several times on the mouse to zoom in on the scale bar. The image should resize and zoom to the scale bar. Right click to zoom back out.
- In the Menu-based ImageJ window select the Straight line selections (5th button from left) by clicking on it with the left mouse button. Position your cursor over the second ImageJ window (map) at the left end of the scale bar. Hold left mouse button down and drag mouse from the left to the right end of the scale bar, and then release the mouse button. An ImageJ created line should now extend along that scale bar.
- In the Menu-based ImageJ window use Menu > Analyze > Set Scale... option to set the scale. A new ImageJ data input window will appear. If your recently created ImageJ line is still on the map, you should see that the "Distance in Pixels" line on the new window is filled with a non-zero number. Do not change the distance in pixels, but do enter the "Known Distance" at the value in the map scale, 0.5. Then enter the "Unit of Length" as km. Click OK to close the data input window.
- In the Menu-based ImageJ window, re-select the Magnifying glass tool and in the second ImageJ window (map), right click to zoom out from the scale bar and show the entire river upstream of the orange dot. In the first ImageJ window, select the Segmented line selections tool and return to the orange dot on the river (map window). Left click on the dot, and then move the mouse cursor upstream along the river, and each significant bend, right click on the river, creating a line along the river. At the end of the river, double left click to end the selection.
- Keeping the segmented line selection on the map, return to the first ImageJ window, use Menu > Analyze > Measure (Ctrl+M) and read and record the river distance.
- In the Menu-based ImageJ window, select the Magnifying glass and resize the map to extend beyond the headwater river and consider its watershed, as shown in blue on the coarse image on this page. Now select the ImageJ Polygon selections or Freehand selections tool (3rd or 4th button from left). You can use either tool to experiment with ImageJ. Position your cursor to delineate the river's watershed. To delineate the watershed above the orange dot, first analyze visually to get a sense for the boundary. Note that the boundary is delineated by tracing perpendicular to Elevation contours and interpolating in-between, such as along ridges. Drag the cursor perpendicular to the Elevation contours. At the ridge, move toward and cross the saddle. Once you have completed the delineation, read and record the watershed area by clicking on Menu > Analyze > Measure.
Image courtesy of USGS
| < Previous | 1 | 2 | 3 | 4 | 5 | 6 | 7 | 8 | 9 | 10 | 11 | 12 | 13 | 14 | 15 | 16 | 17 | 18 | 19 | 20 | 21 | 22 | 23 | 24 | 25 | 26 | 27 | Next > |