
| glossary | menu | Normal | lg | hc | 7.) Classification and Channel Geometry Relations > Estimate Bankfull Cross-Sectional Area Exercise |
| < Previous | 1 | 2 | 3 | 4 | 5 | 6 | 7 | 8 | 9 | 10 | 11 | 12 | 13 | 14 | 15 | 16 | 17 | 18 | 19 | 20 | 21 | 22 | 23 | 24 | 25 | 26 | 27 | Next > |
Estimate Bankfull Cross-Sectional Area Exercise
Exercise Objective
To estimate Bankfull cross sectional area given Bankfull Discharge data and the 9-207 geometric measurements.
Exercise Process
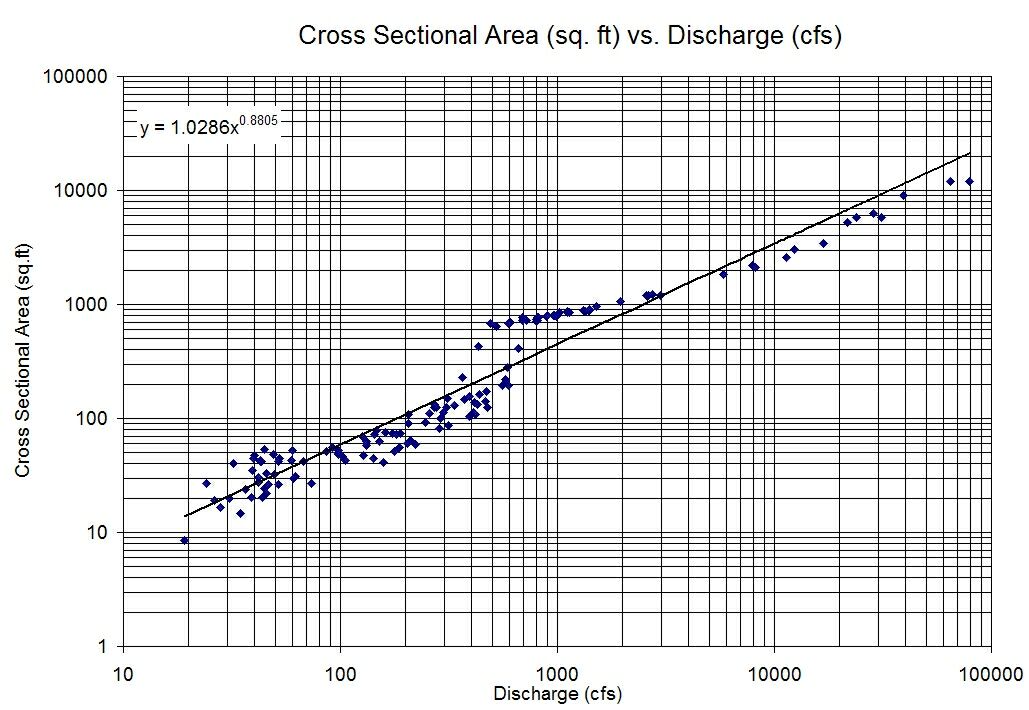
Form 9-207 data can be used to plot a cross-sectional area to discharge relationship. You can either view the graph on this FGM Module page, or use Excel to view the relationship. In Excel, if you downloaded the completed workbook, the graph is already plotted. If you would like to create the graph, the Excel columns to use in the 9-207 worksheet are xsec_area and discharge.With the Bankfull Discharge estimated earlier, find the associated cross-sectional area. To get cross-sectional area, read the nearest graphical data point or use the shown equation.
- Recall the Bankfull Discharge value found earlier in this FGM Module Section.
- Find the Bankfull Discharge (x axis) on the graph to locate the associated cross-sectional area, A, (y axis) point.
- Consider the scatter of the data versus the narrowness of the regression line, and choose the most representative for your estimate.
- Record the A in square feet from the log plot.
| < Previous | 1 | 2 | 3 | 4 | 5 | 6 | 7 | 8 | 9 | 10 | 11 | 12 | 13 | 14 | 15 | 16 | 17 | 18 | 19 | 20 | 21 | 22 | 23 | 24 | 25 | 26 | 27 | Next > |