
| glossary | menu | Normal | lg | hc | 7.) Classification and Channel Geometry Relations > Estimate the Bankfull Discharge Exercise |
| < Previous | 1 | 2 | 3 | 4 | 5 | 6 | 7 | 8 | 9 | 10 | 11 | 12 | 13 | 14 | 15 | 16 | 17 | 18 | 19 | 20 | 21 | 22 | 23 | 24 | 25 | 26 | 27 | Next > |
Estimate the Bankfull Discharge Exercise
Exercise Objective
To estimate Bankfull Discharge given Bankfull stage and the 9-207 and WATSTORE stage-discharge relationship.
Exercise Process
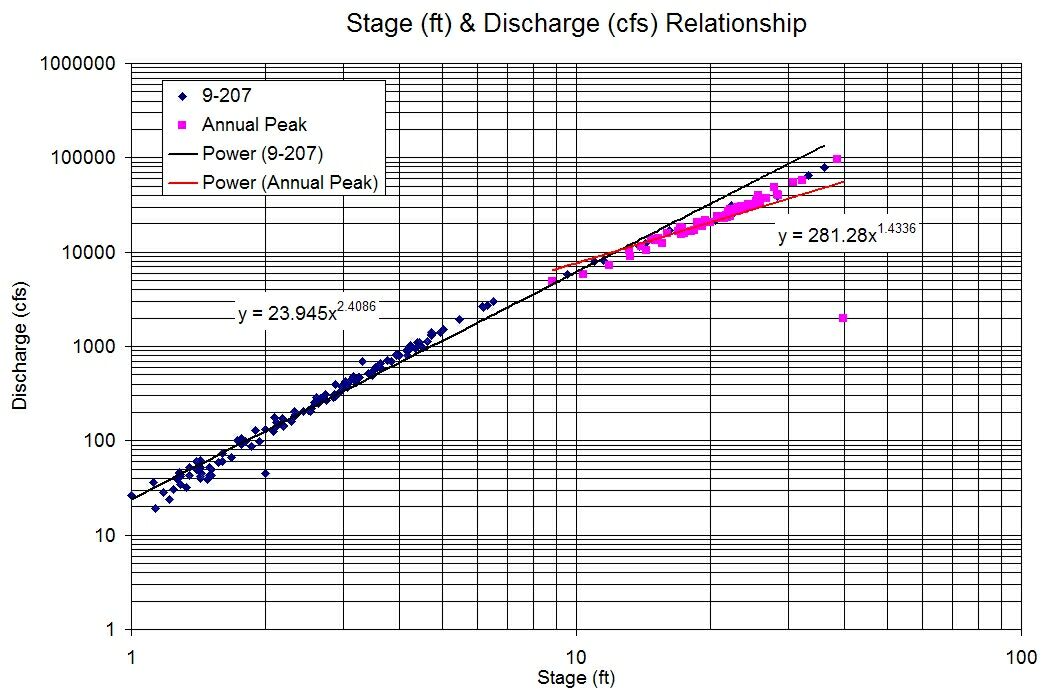
Form 9-207 data can be used to plot a historical stage-discharge relationship. WATSTORE data can provide a stage-discharge curve for peak flows, which may better represent Bankfull flow. You can view this graph with the two relationships at right, or download the image by right clicking and saving to your computer for viewing. Alternatively, you can view in Excel if you downloaded the completed worksheet.If you wish to create this plot, the columns to use in the 9-207 worksheet are inside_gage and discharge, and the columns in WATSTORE worksheet are stage and discharge. 9-207 data are graphed in blue color and WATSTORE data are graphed in salmon color. Note that this is not a fixed relationship for a point in time. Also note that stage is often different from depth, were stage is relative to some Datum other than the base of the channel.
- Recall the Bankfull stage value given earlier in this FGM Module Section.
- Find the Bankfull stage (x axis) on the graph to locate the associated Bankfull Discharge, Q, (y axis) point.
- Consider the two slopes, and use the most representative.
- Record the Q in cubic feet per second from the log plot.
| < Previous | 1 | 2 | 3 | 4 | 5 | 6 | 7 | 8 | 9 | 10 | 11 | 12 | 13 | 14 | 15 | 16 | 17 | 18 | 19 | 20 | 21 | 22 | 23 | 24 | 25 | 26 | 27 | Next > |